Clanker Labs · private repo

selftrade

A backtest is a machine for producing encouraging numbers. Point a naive one at any strategy and it will tell you the strategy works. This one is built to say no.

paper by default 43 tests source not public
Every number in this animation is from a real run — 64 trades, the actual equity curve, the verdict the tool actually returned.
The problem

Four ways a backtest lies

Left alone, the default implementation of every step quietly resolves ambiguity in the strategy's favour. Three of these are fixable in code. The fourth is only fixable in how you report.

Look-ahead

A signal computed from a bar's close, filled at that same bar's open. One bar of clairvoyance and the equity curve is beautiful.

A signal can only fill on the next bar's open, and the API makes it awkward to do otherwise.

Fills at prices nobody traded

A stop that fills exactly at the stop price assumes somebody was standing there. Capping every loss at −1R deletes tail risk from the curve entirely.

Gaps through a stop fill at the gap. Gaps through a target still fill at the target — asymmetric on purpose, because the orders that get run past are resting stops.

One good period

"62% win rate" over eleven trades is not a win rate. It is seven trades.

Every result carries its window and its trade count, and the tool computes the odds a coin weighted to break even would have done as well.

Optimising until it works

The best cell in a grid of twenty, on a sample of twenty trades, is the cell that fit the noise best. That is what "best" means at that size.

The sweep reports the plateau — what fraction of the grid was profitable — above the winning cell.
What it found

The strategy it ships with lost money

The 15-minute opening range breakout, transcribed from source rather than from folklore. Scored across five instruments over the 29 days of one-minute data free feeds will serve.

instrumenttradeswin rate expectancy
QQQ911%−0.817R
SPY1429%−0.130R
IWM1436%+0.021R
NVDA1443%+0.046R
TSLA1315%−0.574R
pooled6428% −0.245R

Break-even at 1:3 is 25%, so 28% sounds survivable until the losers turn out to be full stops and the winners mostly time out flat. Read it with the caveats attached, because they are load-bearing: one month, one market regime, and only 60% of the instruments agree in sign — which means the pooled figure is partly an average of unrelated results.

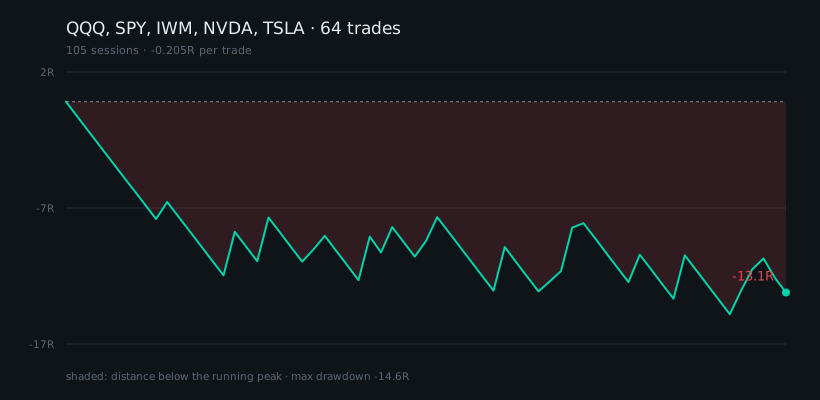
Equity curve in R across 64 trades, falling steadily from 0 to −15.7R, with the area between the curve and its running peak shaded.
Cumulative return in R — units of the risk taken, the only unit that compares across instruments. The shaded area is the distance below the running peak: the drawdown you would have had to sit through, which an equity line alone makes invisible.
The output

What "no" looks like

Three checks, and a sign test that settles a question worth settling.

selftrade run QQQ
$ selftrade run QQQ

 sessions       21 (12 with no setup)
 trades         9
 win rate       11% (break-even is 25%)
 expectancy     -0.817R per trade
 exits          1× session end, 8× stop

Not evidence yet:
  • 9 trades is below the 30 needed to say anything. Every number
    here is an anecdote.
  • a coin weighted to break even produces a run this good 92% of
    the time. That is not a signal.
  • expectancy is not positive: it lost money on this sample.

Sign check: mirrored, the same trades score +0.817R. A weak rule
mirrors to roughly break-even; a large, symmetric flip means the
direction logic is inverted -- a bug, not a strategy.

That last check earned its place the hard way. The first version of this strategy lost in every configuration, with win rates below random for its payoff — and the mirrored trades came back large and symmetric, which reads exactly like an inverted signal. It was not. It was four bugs in the harness, and the flip was the symptom.

The stop was the interesting one. "20 to 25 points" is a fact about Nasdaq futures, where the index trades near 20,000. Copied onto a $600 ETF it is a 4% stop that never triggers; scaled to keep the percentage it becomes 0.6, which sits inside one-minute noise — the 90th-percentile minute spans about 0.8 — so it is hit by the bar you entered on, at random. Thirteen consecutive stops at −1.02R, and it reads as a broken strategy rather than a broken measurement.
Execution

Paper by default. Live is never inferred.

Two independent switches, and the failure being defended against is not you changing your mind.

arming live
# 1. at the call site
broker = HyperliquidBroker(address=..., live=True)

# 2. in the shell that is placing orders
$ export SELFTRADE_ARM_LIVE=i-understand-this-sends-real-orders

# either one alone:
NotArmed: live=True was requested but the environment is not armed.

Why two

The thing being defended against is a cron entry, a script, or an agent inheriting an environment it did not read. The environment variable has exactly one purpose, so nothing can arm it as a side effect of doing something else — and the check runs at the moment of sending, so a broker built while armed cannot keep sending after the environment is disarmed.

Order placement on Hyperliquid is deliberately not implemented. Signing means the account key in-process, and a hand-rolled EIP-712 signer gets it subtly wrong and sends a valid signature for an order nobody meant. Reads are genuine and need no key.

The dashboard is read-only by construction: no route takes a side or a size, and it does not import anything that can send. A dashboard that can be reached is a dashboard that can be reached by something other than you, and the safe design is one where the worst outcome of that is a stale chart.