Clanker Labs · open source

tradesights

Talk is cheap. Options cost money. This ranks the stocks where those two stop agreeing — and puts the biggest disagreement at the top of one list you can read before coffee.

Every number in this is from a live scan — 43 names, their actual z-scores, the headlines the tool actually wrote.
The premise

Three layers, and the distance between them

A price chart is the layer everybody already has. The information is in how far it has drifted from the other two.

layer one

Price

What already happened. It is a fact, it is free, and by the time a chart looks obvious it is in the price.

layer two

Positioning

What somebody paid to be right about. A trader who is long a stock and quietly buying puts against it is telling you something they would not post. That signal cost the person sending it money.

layer three

Talk

What people say will happen — free to produce, which is the whole problem with it. It counts at half weight, never more, so a loud enough crowd cannot outvote the people actually paying.

Every layer is z-scored against the names scanned in the same run, not against an absolute scale. A raw skew of 0.04 is neither high nor low; it is high or low for that name, today, against everything else you could be looking at instead. A utility and a biotech do not share a scale, and neither does a sleepy Tuesday and the morning after a CPI print.

The four situations

Crossing price against positioning

The names describe what a person is doing, rather than what the greeks say.

price down
price up
calls bid
Contrarian Bid
Someone is paying for a bounce.
Chase
Trend confirmed, and crowded.
puts bid
Fear
The market believes the drop.
Hedged Rally
Holders are nervous.

Two of these are agreement and two are disagreement, and only the disagreements are the point. That is why the map below shades two quadrants and leaves the other two plain: a name whose price and options point the same way is the normal case, and giving it equal visual weight would be giving equal weight to the boring half of the market.

Real output · a scan run on 26 August 2026

The whole universe, not the top of it

A ranked list says what to look at. It cannot say whether today is unusual — five names above a divergence of 2 is either a market coming apart or an ordinary Tuesday, and the top of a table looks identical either way.
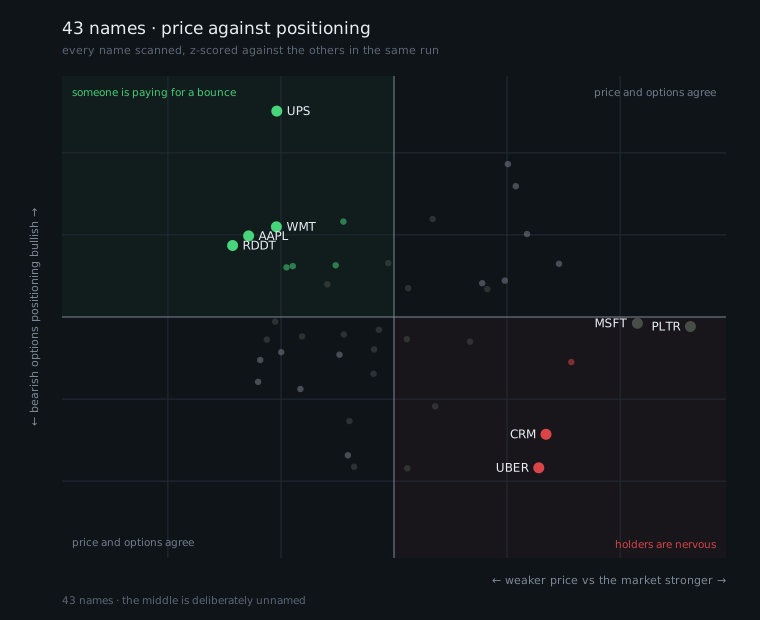
Scatter plot of 43 stocks, price against options positioning, both z-scored. UPS, WMT, AAPL and RDDT sit in the upper-left quadrant where price is weak but calls are bid. UBER and CRM sit in the lower-right where price is strong but puts are bid. Most names cluster near the origin.
43 names on one plot. A morning where everything sits in the middle is a cloud around the origin; a morning where the options market has stopped agreeing with price grows two diagonal wings. Generated by tradesights chart — a standalone SVG, no plotting library and nothing to install.
tradesights scan
$ tradesights scan
scanned 43 names, 43 with usable option chains

1. UPS  down 9% vs the market, but call buyers are stepping in —
   someone is paying for a bounce
   · options market split — protection is being paid for while calls trade
   divergence 3.55

2. UBER  up 14% vs the market, but protection is being bought —
   holders are nervous
   divergence 3.12

3. CRM  up 15% vs the market, but protection is being bought —
   holders are nervous
   divergence 2.77

This is a screener. Every name above is a question, not a call.
No greeks in the output. The tool does the interpreting so the reader does not have to do it at seven in the morning.
Sharp edges

Where it will cut you

A tool that tells you its own failure modes is more trustworthy than one that does not.

It cannot trade

There is no order execution in this repo and no path from it to a broker, deliberately and permanently. It reads and it reports. It is also not backtested and carries no performance claims — somebody else's six months of trades is not evidence a method works, and there is no number here chosen to make the idea sound better than it is.

Run it

Four commands

bash
$ git clone https://github.com/Clanker-Labs/tradesights && cd tradesights
$ uv sync

$ tradesights scan        # which names disagree with themselves
$ tradesights rotation    # where money is moving, by sector
$ tradesights name NVDA   # everything known about one name
$ tradesights chart       # the whole universe, as an SVG

It also ships an MCP server, so an agent can run the scan and post the digest to a chat without a person opening anything.